By Kim McDarison
A report, titled: Human Trafficking and Drug Offenses 2013-2022 Special Report, released by the Criminal Justice Information Services Division of the FBI Tuesday shows, among its findings, an increase in reporting of human trafficking to the bureau’s Uniform Crime Reporting (UCR) program, along with a propensity for offenders to use as “a common tactic” drugs and narcotics to “coerce and subdue their victims, which could lead to drug trafficking.”
According to information released by the division, the FBI’s UCR program released the report after its staff examined “drug offenses in connection with human trafficking incidents compared to the number of human trafficking incidents per year.
The program began collecting human trafficking data in January of 2013.
Additionally, a link to data — collected through the FBI’s National Incident-Based Reporting System (NIBRS) — about violent crimes reported to the bureau between 2009 and 2022 is included within the released information. The data offers a picture of violent crime trends within the study period across the nation, by state and locally.
The link shows participation within the FBI’s NIBRS by law enforcement agencies across the state of Wisconsin, including the Fort Atkinson Police Department, the Whitewater Police Department and the University of Wisconsin-Whitewater, with each local entity reporting information to the FBI beginning in 2020, 2017 and 2016, respectively.
According to Tuesday’s release, the FBI collects data through the NIBRS and the Summary Reporting System (SRS), however, the release noted, relative to the human trafficking study, “because of the hierarchy reporting method used in the SRS, only NIBRS data were used in this analysis.”
The release read: “NIBRS allows additional offenses to be reported that are connected to an incident, creating more detail-rich data.”
The release stated that participation in the FBI’s data collection program is voluntary for state, county, city, territorial, university/college, and tribal law enforcement agencies. Federal law enforcement agencies are mandated to participate. The release further noted that between 2013 and 2022, on average, 86% of agencies participated in the program, and the average population covered by the program was 94%.
Among its conclusions, the human trafficking special report found that “more than 8,700 reported incidents involved human trafficking from 2013 to 2022. Since 2013, the number of reported human trafficking incidents, offenses and victims has increased. The number of incidents is nearly a linear increase each year, which is expected as participation in NIBRS increases,” the release stated.
Additionally, the release noted: “Although the FBI does not have a specific drug trafficking offense, it does have offenses for drug abuse violations. Therefore, drug offenses in connection to human trafficking incidents were compared to the number of human trafficking incidents per year. This comparison revealed the South region (of the U.S.) had a rate of over 57 drug offenses per 100 human trafficking incidents, which was the highest rate of the four regions. The South region is the largest region in both agency count and population. The West region had a rate of nearly 22 drug offenses per 100 human trafficking incidents, which was the second highest rate. Portions of the U.S., labeled “Midwest” and “Northeast,” ranked third and fourth, respectively.
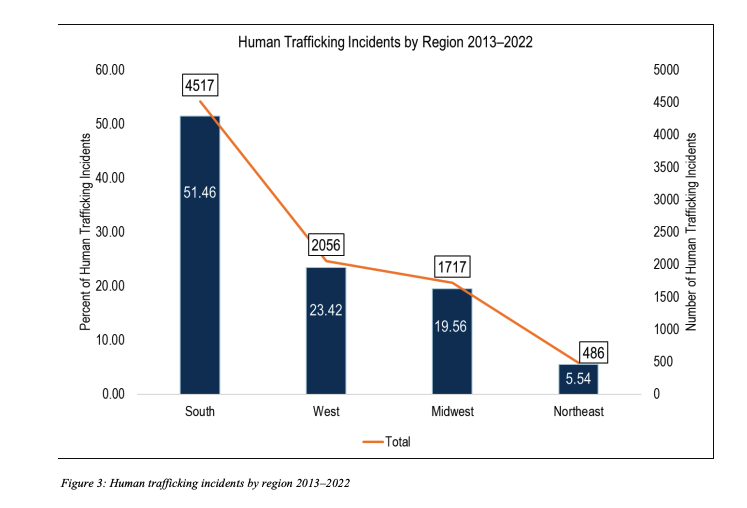
A chart above, as supplied within the FBI’s Special Report on Human Trafficking released Tuesday, shows human trafficking incidents by U.S. region — South, West Midwest and Northeast — between 2013 and 2022. The chart shows, and the study found, that incidents of human trafficking were highest within the South, followed by the West, then Midwest, and finally, Northeast.
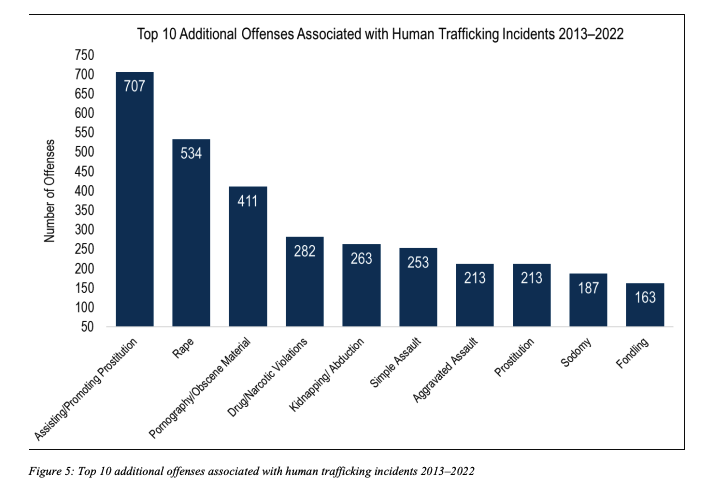
The data also revealed, as shown in the FBI’s chart above, drug/narcotic violations ranked fourth in additional offenses associated with human trafficking. The three most common additional offenses—promoting/assisting prostitution, rape, and pornography/obscene material—were expected as 84 percent of human trafficking incidents were reported as commercial sex acts.
According to the special report, “the data cannot determine if drug trafficking often occurs in conjunction with human trafficking, nor can it be determined that human trafficking is the cause of drug trafficking or vice versa. However, it can be determined that as reports of human trafficking increase, reported victims, offenders, and drug offenses also increase.”
Who were the victims?
According to the special report, between 2013 and 2022, “more than 10,000 victims of human trafficking were reported to the FBI’s UCR program.
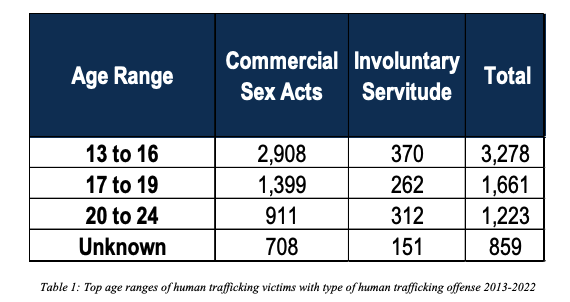
An FBI chart, shown above, offers a look at the age ranges of those who fall victim to human trafficking and through which types of offenses.
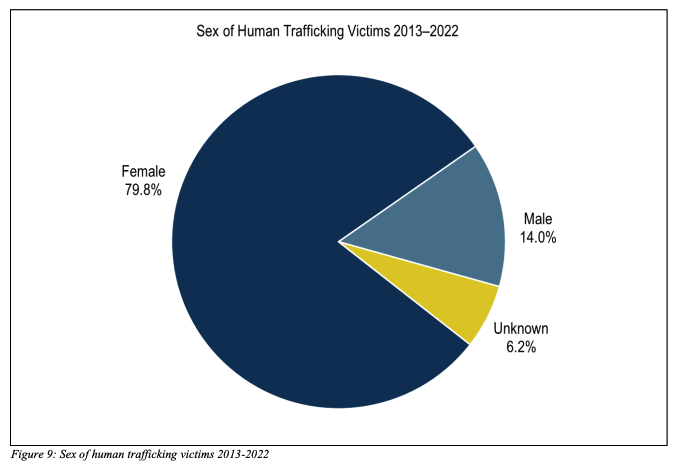
While the study points out that human trafficking exploits both male and female individuals, the majority, nearly 80%, are female. Some 58% of the reported victims, between 2013 and 2022, the study found, were White, 25% were Black, 2.5% were Asian, 1.4% were American Indian or Alaska Native, 0.03% were Native Hawaiian or other Pacific Islander, and 12.9%, as shown in the chart above, were labeled as “unknown.”
Wisconsin’s violent crime stats
According to the “Crime Data Explorer” pages that are linked to the FBI’s special report release, Wisconsin’s violent crime data were derived from both the NIBRS and the SRS reports which were voluntarily submitted by state and local law enforcement agencies to the FBI.
A page summary states that “the 2022 estimated crime statistics for Wisconsin are based on data received from 422 of 455 participating law enforcement agencies in the state for that year.”
Among information found on Wisconsin’s data explorer page is the “trend of violent crime” from 2012 to 2022.
A chart depicting the rate of violent crime offenses in Wisconsin by population shows Wisconsin trending across the study period below the U.S. violent crime rate. While the chart indicates a peak in violent crime in 2020 and 2021 in Wisconsin, the numbers show a decline in 2022.
Offenses categorized as “violent crime” include murder, nonnegligent manslaughter, rape, robbery, and aggravated assault.
Property crime statistics include such offenses as burglary, larceny-theft, and motor vehicle theft.
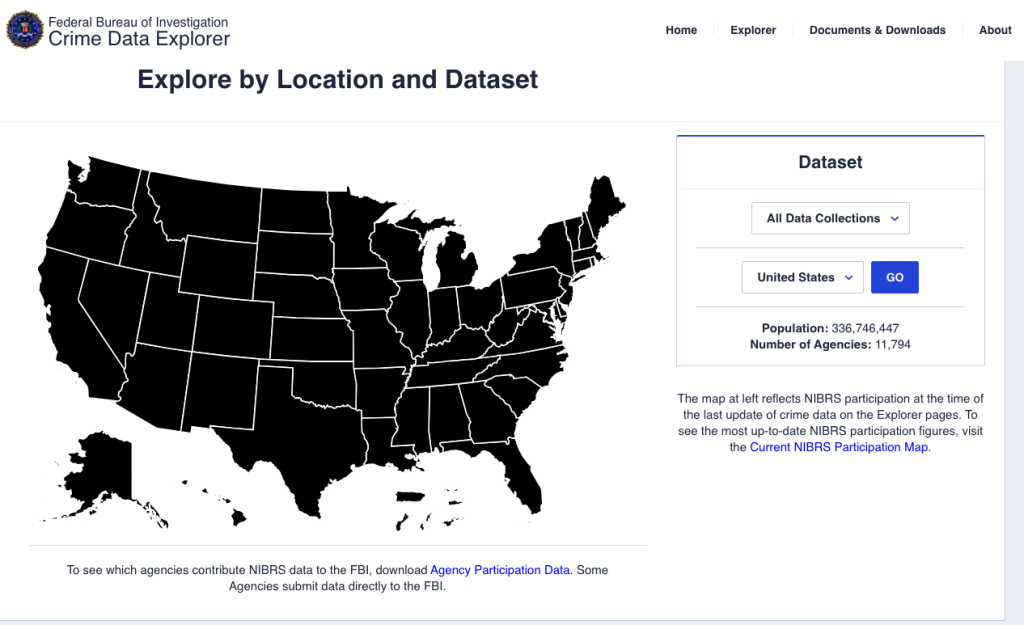
The graphic, shown above, provides an interactive map which greets visitors to the FBI’s Crime Data Explorer page. A list of 11,794 law enforcement agencies, nationwide, with jurisdictions that collectively include a U.S. population of 336,746,447, according to the webpage, is included with the map. In Wisconsin, the data includes information provided by 422 law enforcement agencies representing a population of 5,892,539. The Fort Atkinson Police Department, The Whitewater Police Department and the UW-Whitewater are counted among them.
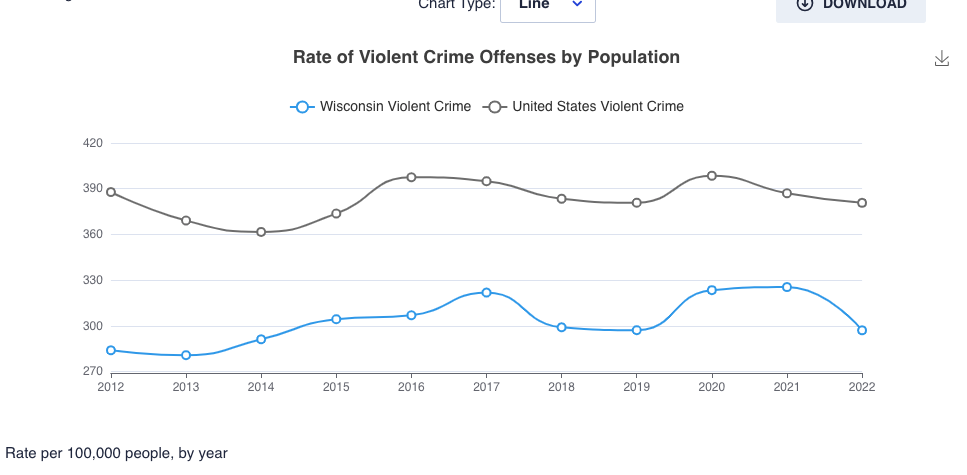
A chart, shown above, as found within the link to Wisconsin’s violent crime data, compares trends across the state to those found in Wisconsin. The graph shows that between 2021 and 2022, Wisconsin saw a downward trend in violent crime.
In 2022, the page notes, there were 14,941 violent crime incidents and 17,330 offenses reported by 382 law enforcement agencies that submitted data to the NIBRS. The numbers cover 95% of the state’s population.
The page notes that in 2022, there were 286 homicide incidents and 312 offenses reported.
In 2022, there were 2,110 rape incidents and 2,210 offenses reported.
The page additionally sorts violent crimes in Wisconsin by offender age and victim age.
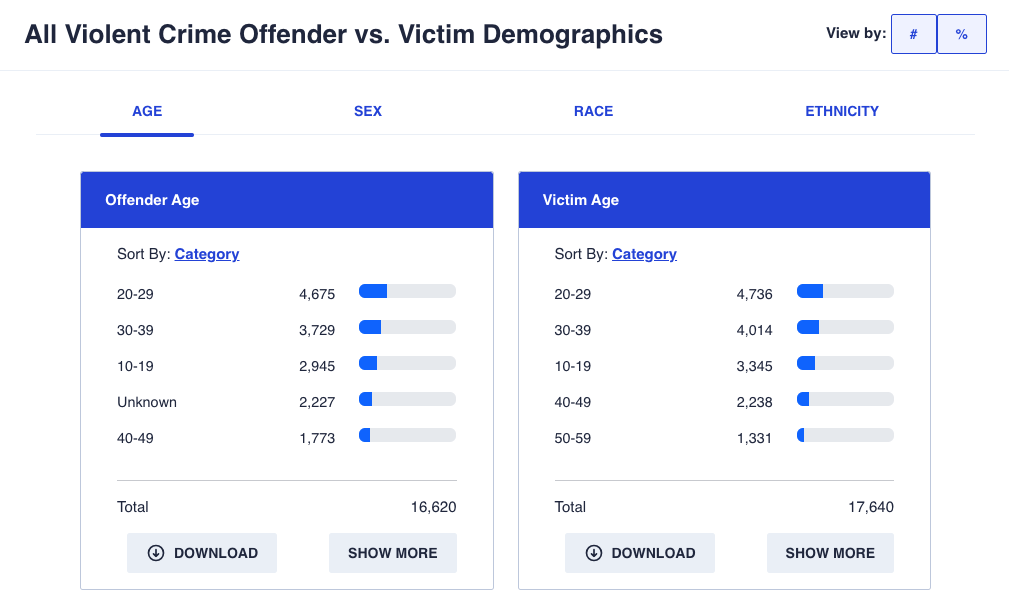
In Wisconsin, in 2022, some 4,675 violent crimes were committed by individuals between the ages of 20 and 29; 3,729 violent crimes were committed by individuals ages 30-39; 2,945 violent crimes were committed by individuals ages 10-19; another 2,227 violent crimes were committed by individuals of an unknown age, and 1,773 violent crimes were committed by individuals ages 40-49. An expanded version of the graphic, shown above, notes that some 859 violent crimes were committed by individuals ages 50-59, and 302 violent crimes were committed by individuals between the ages of 60 and 69. Crimes committed by individuals 70 and older cumulatively totaled 110, with one crime committed by an individual who was 90 or older.
In Wisconsin, in 2022, those falling victim to violent crimes were as follows: 4,736 crimes were committed against individuals between the ages of 20 and 29; 4,014 were committed against individuals between the ages of 30 and 39; 3,345 were committed against individuals between the ages of 10 and 19; 2,238 were committed against individuals between the ages of 40 and 49; 1,331 were committed against individuals ages 50-59; 838 were committed against individuals ages 0-9; 694 were committed against individuals ages 60-69; 216 were committed against individuals ages 70-79; 150 were committed against individuals of unknown age; 69 were committed against individuals ages 80-89, and 9 violent crimes were committed agains individuals ages 90 and older.
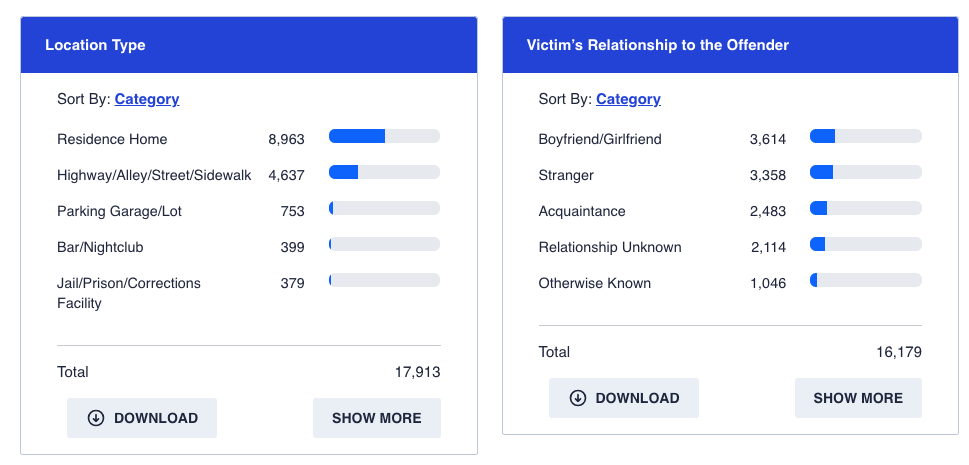
The page makes available information about where violent crimes occurred. In 2022, as shown in the graphic above, in Wisconsin, a majority, some 8,963 violent crimes occurred in a residence or home. Another 4,637 occurred on a highway, alley, street or sidewalk. Some 753 occurred in a parking garage or lot, and 399 occurred in a bar or nightclub. Another 379 violent crimes occurred in a jail, prison or corrections facility.
Other locations included: 316, occurring in a hotel or motel; 290 occurring at a gas station; 268 occurring in an unknown location; 245 occurring at a convenience store; 230 occurring at a park or playground; 216 occurring at a elementary or secondary school; 191 occurring at a restaurant; 148 occurring at a drug store, doctor’s office of hospital; 147 occurring at a department or discount store; 110 occurring at a grocery store; 103 at a specialty store; 59 at a bank; 49 at a government or public building; 44 at a college or university; 43 at a commercial office building; 41 in an outdoor space described as “field/woods”; 36 at a shopping mall; 30 at a liquor store; 23 at a campground, and those with lower recorded incidents occurring at transportation terminals, daycare facilities, rental storage facilities, lakes and beaches, community centers, homeless shelters, abandoned structures, gambling facilities, fairgrounds, auto dealerships, places of worship, amusement parks, ATMs in locations that are separate from banks, farm facilities, industrial sites, school/college, rest areas, construction sites, shipping terminals, and tribal lands.
Also determined within the study, the majority of individuals succumbing to violent crime in Wisconsin in 2022, some 3,614 individuals, were a boyfriend or girlfriend of the perpetrator. Another 3,358 individuals were victimized by strangers.
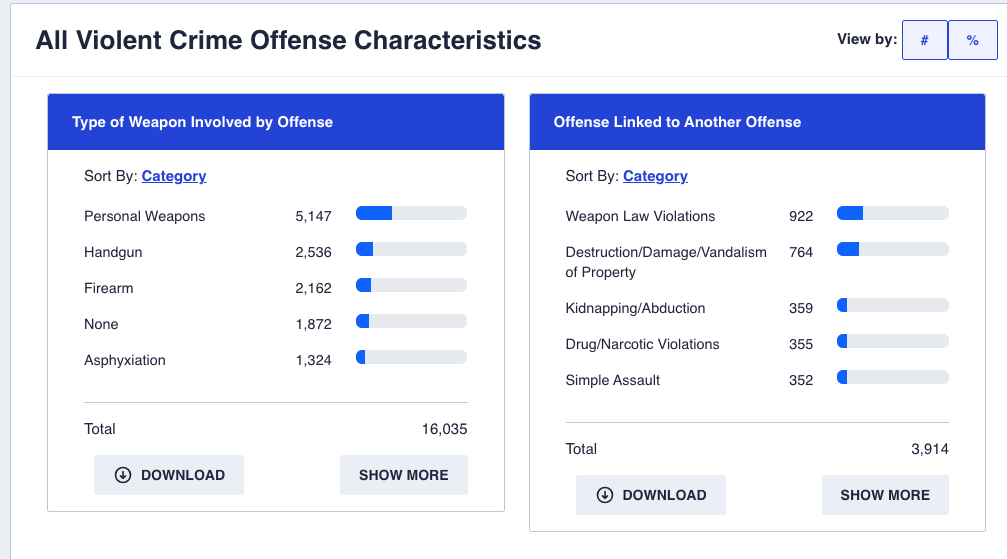
Of those committing violent crimes in Wisconsin in 2022 some 5,147 had a “personal weapon” which was involved in the offense. Another 2,536 individuals involved a “handgun.” Some 2,162 offenses involved a “firearm.”
Some 1,872 offenses were categorized as not involving a weapon.
Other weapons used during violent crime incidents included blunt objects, rifles, shotguns, drugs, automatic handguns, incendiary devices, poison, and explosives.
Among other offenses linked to violent crime offenses were weapon law violations, vandalism, kidnapping, drug violations, and simple assaults, among others.
Fort Atkinson’s violent crime stats
According to the page, the Fort Atkinson Police Department began submitting NIBRS data to the FBI in January of 2020.
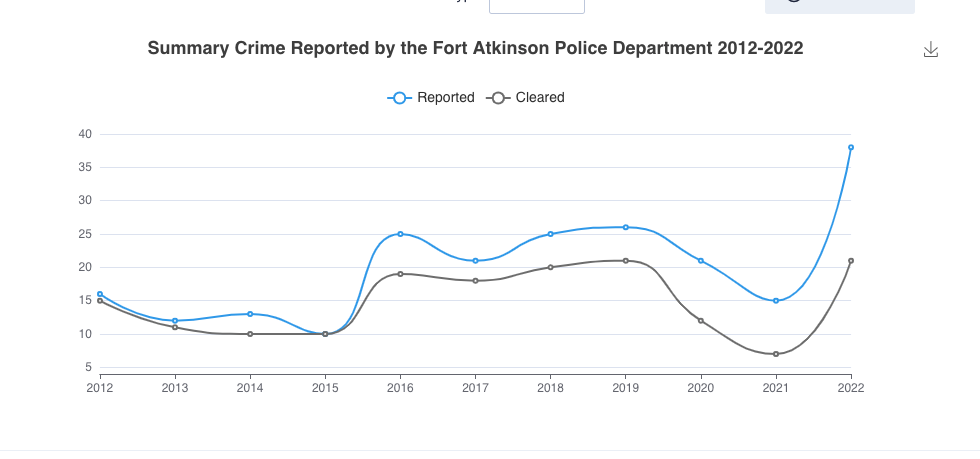
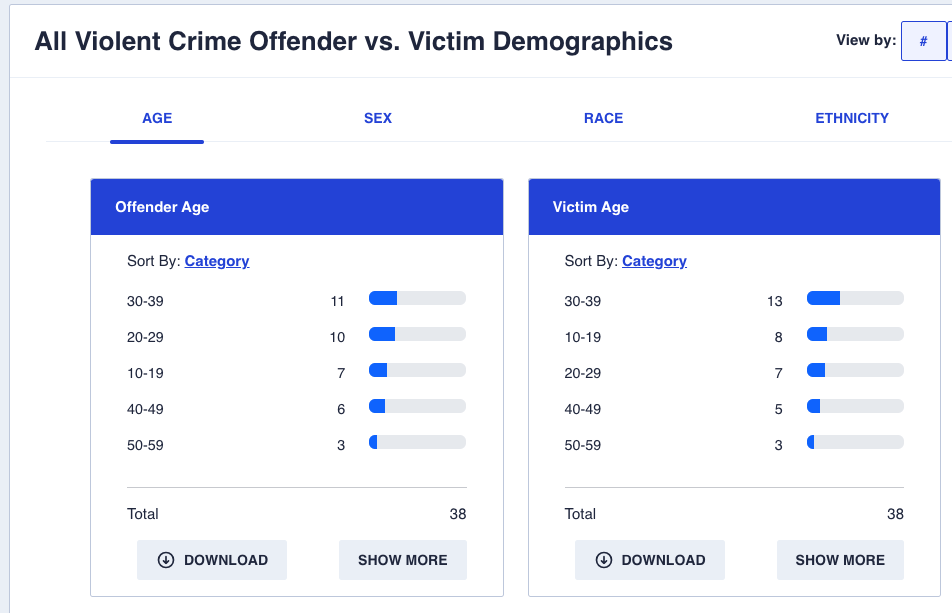
A chart labeled: “Summary Crime Reported by the Fort Atkinson Police Department 2009-2022, shown above, shows an uptick in 2022 in all violent crimes reported, with a total number of violent crimes, depicted in the chart, shown below, reported at 35 in 2022, of which 11 were perpetrated by individuals between the ages of 30 and 39, 10 by individuals between the ages of 20 and 29, seven by individuals between the ages of 10 and 19, six by individuals between the ages of 40 and 49, three by individuals between the ages of 50 and 59, and one by an individual between the ages of 60 and 69. The ages of victims were as follows: 13, ages 30-39; eight, ages 10-19; seven, ages 20-29; five, ages 40-49; three, ages 50-59; one between the ages of 0 and 9, and one between the ages of 60 and 69.
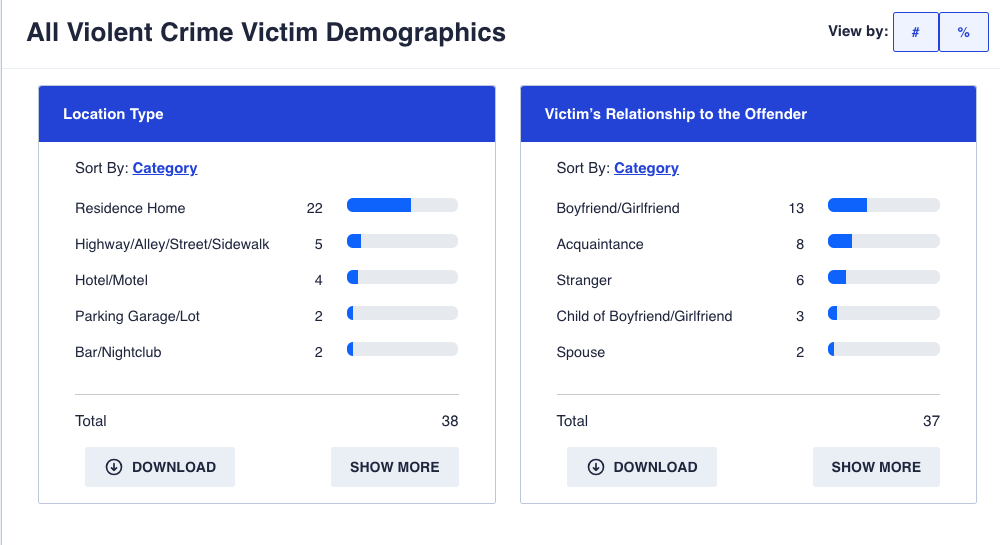
Twenty-two incidents, as noted in the graphic below, occurred in a home or residence, with all others occurring in a street, hotel, parking facility, bar, an unknown space or grocery store.
Thirteen victims were in a boyfriend or girlfriend relationship with the perpetrator; eight were acquaintances, six were strangers, three were the child of a boyfriend or girlfriend, two were spouses, among others.
Some 17 of the incidents, as noted in the graphic below, involved a personal weapon, and three of the violent offenses were linked to another crime, with kidnapping/abduction listed as a component of three of the violent offenses.
Whitewater’s violent crime stats
According to the report, the Whitewater Police Department began submitting data to the NIBRS in December of 2017.
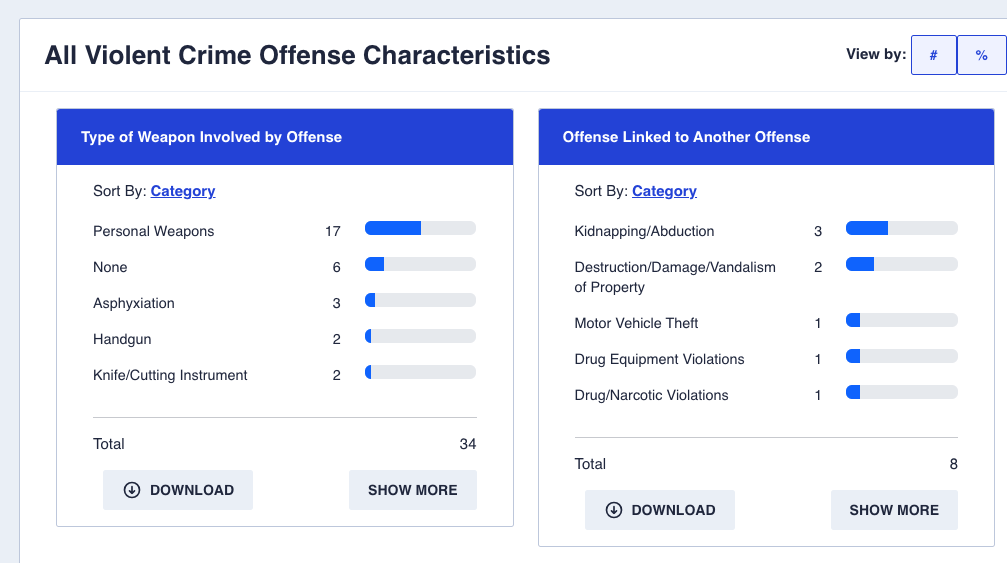
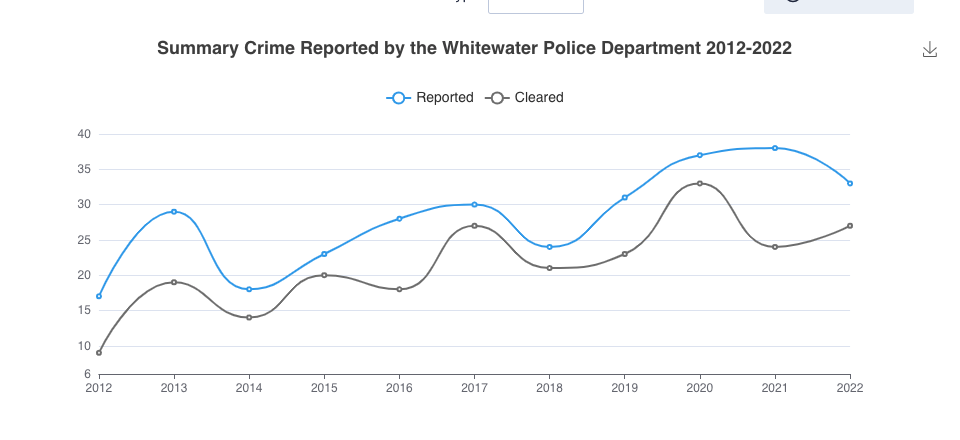
A chart labeled: “Summary Crime Reported by the Whitewater Police Department 2009-2022, shown below, shows a steady increase in violent crime over the selected years, with a decreasing trend beginning in 2021. Some 33 violent crime incidents were reported by the Whitewater Police Department in 2022.
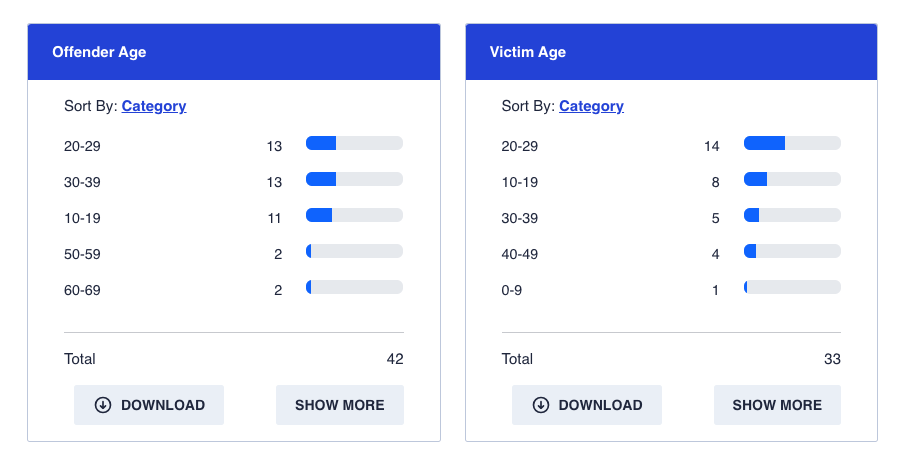
Of the 42 offenders involved, as shown in the graphic below, 13 were between the ages of 20 and 29; 13 were between the ages of 30 and 39; 11 were between the ages of 10 and 19; two were between the ages of 50 and 59; two were between the ages of 60 and 69, and one was between the ages of 40 and 49.
Of the victims of the reported crimes, 14 were between the ages of 20 and 29; eight were between the ages of 10 and 19; five were between the ages of 30 and 39; four were between the ages of 40 and 49; one was between the ages of 0 and 9, and one was between the ages of 60 and 69.
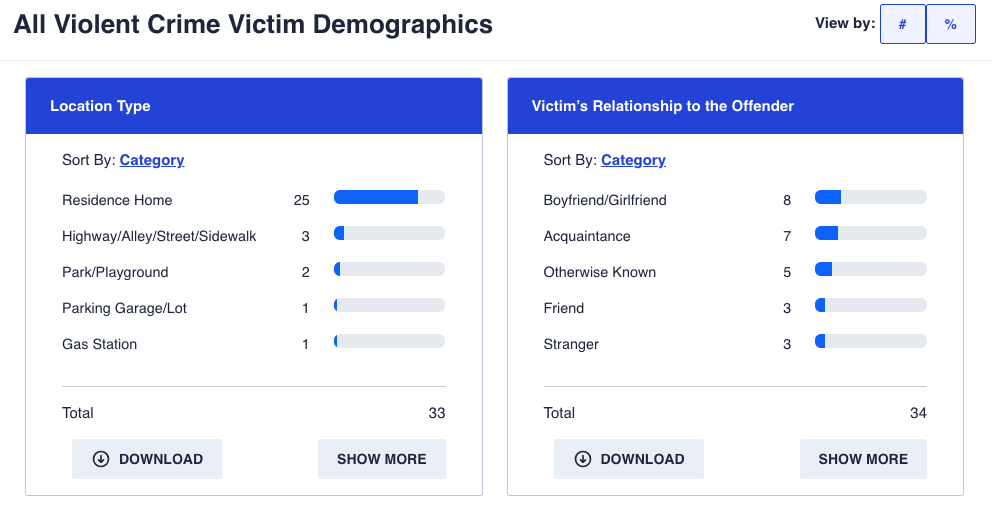
In 2022, 25 of the reported violent crimes were committed in a home or residence, as noted in the graphic below, three on a street or sidewalk, two in a park or playground, one in a parking facility, one at a gas station, and one at a specialty store.
Eight of the victims had a boyfriend or girlfriend relationship with the offender; seven were acquaintances, five were “otherwise unknown,” three were friends, three were strangers, two were children of a boyfriend or girlfriend, two were described as “other family member,” thwo were siblings, one was a child and one was an “ex spouse.”
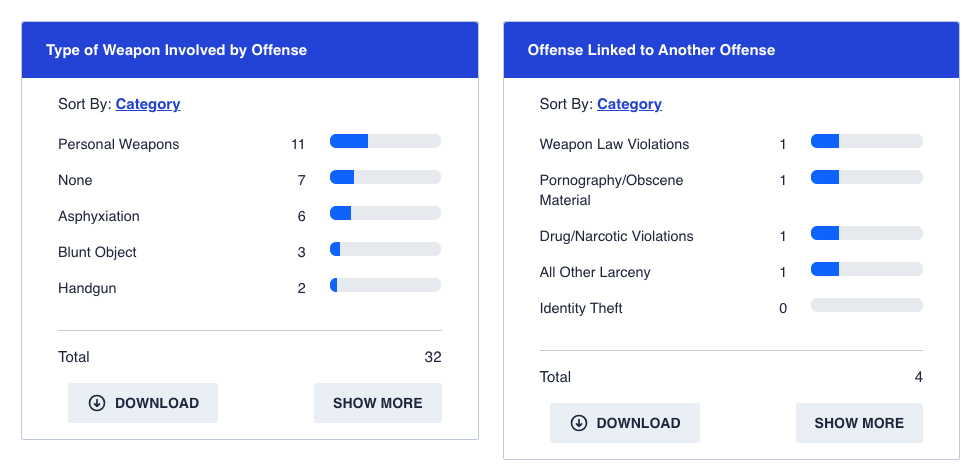
Eleven of the offenses involved a personal weapon, as noted in the graphic below, seven involved no weapon, six involved asphyxiation, three involved a blunt object, two involved a handgun, two involved a knife or cutting instrument, and one involved drugs.
Offenses that were linked to the violent crimes included one weapon law violation, 1 pornography/obscene material violation, one drug/narcotics violation, and one violation listed as “all other larceny.”
University of Wisconsin-Whitewater’s violent crime stats
According to the report, the University of Wisconsin-Whitewater began submitting data to the NIBRS in January of 2016.
A chart labeled: “Summary Crime Reported by the University of Wisconsin: Whitewater 2009-2022 noted an uptick in 2022 in all violent crimes reported, with a total number of six violent crimes reported in 2022. Of the crimes, four were committed by offenders between the ages of 20 and 29, and three were committed by offenders between the ages of 10 and 19. Four of the victims involved in the violent incidents were between the ages of 10 and 19, and two were between the ages of 20 and 29. Of the incidents reported, three were committed within a residence or home, two were committed at the school, and one was listed as “unknown.” Five of the victims were acquainted with their offender and one was listed as “otherwise known.” Four of the six offenses did not involve a weapon. Two of the offenses involved “personal weapons.”
A link to the FBI’s Crime Data Explorer website, including filters which allow users to organize the data in multiple configurations, is here: https://cde.ucr.cjis.gov/LATEST/webapp/#/pages/explorer/crime/crime-trend.
This post has already been read 1424 times!
Very interesting article. Thank you for printing it.