By Kim McDarison
The Wisconsin Policy Forum, a nonpartisan, independent policy research organization, recently published a report titled: “Local Debt on the Rise,” which states, among its findings, that statewide, local government debt “hit record levels in 2020,” and is projected to continue to rise.
The report identifies debt, over the last two decades, as being “driven upward by low interest rates, infrastructure needs, and a little-known incentive in state law.
“Even after adjusting for inflation and population growth, debt levels are the highest on record for cities and other municipalities in the state,” the report continued, but, it stated, “while the growth in property values has made it easier for local governments to repay their debts, currently rising interest rates could create new challenges by increasing the costs of new debt and slowing the growth of property values.”
Among its conclusions, the report recommends that policymakers consider options to “slow the growth of local debt, from incentivizing local governments to team up on capital projects and purchases such as a new road or fire engine to giving local governments more flexibility in raising revenues.”
According to the report, total debt owed by local governments within the state rose by 5.4% in 2020, earning it the distinction of being the “highest level on record.”
By year’s end in 2020, local governments, such as cities and counties, owed $11.4 billion, which, the report stated, represented an increase of $566 million over the previous year.
In recent years, the report noted, several factors have driven municipalities to borrow money, counting a need to replace aging infrastructures and update IT systems among them, facilitated by previously low interest rates.
The report further points to the use of “incentivized borrowing,” created through state law, for governments to pay for projects and capital purchases rather than using cash.
“The picture is not all alarming. Counties, for example, have not borrowed so heavily over the past decade and all local governments have benefitted greatly from rising property values that make it easier to pay off their debt,” the report stated.
Additionally, the report noted, that while most debt is owed by cities, “the fastest growth in debt since 2015 has been in Wisconsin towns.”
The report poses the following question: “Given the recent increase in borrowing and the fact that interest rates are now on the rise, … could debt payments begin to crowd out spending on local services such as police, fire protection, parks and libraries?”
According to the report, findings were developed using data from the Wisconsin Department of Revenue (DOR), looking back as far as the year 2000 and included all cities, villages, towns and counties within the state, totaling some 1,920 governments.
The data is derived from financial statements filed by the governments with the DOR.
“The figures deal exclusively with general obligation debt, or debt that municipalities and counties have pledged through property tax levy and other local taxes to repay,” the report stated.
Offering a comparison, the report noted that in December of 2000, cities, villages, towns and counties statewide collectively owed $5.23 billion in general obligation debt. By the end of 2020, the total general obligation debt had more than doubled, and had risen 40.5% after adjusting for inflation.
The report noted: “Most of that increase was due to an increase in debt owed by the state’s 602 cities and villages, which rose from $3.5 billion at the end of 2000 ($5.26 billion in 2020 dollars) to $7.88 billion in 2020, an inflation-adjusted increase of 49.9%. The state’s 72 counties, however, have borrowed less heavily over the past decade and their $2.69 billion in total debt at the close of 2020 was down somewhat from its inflation-adjusted peak of $2.9 billion at the end of 2010.”
Looking at debt as it related to population, the policy forum reported: “When looking at municipalities by their size, debt rose the most from 2000 to 2020 in cities with more than 30,000 residents (144.9%) and barely outpaced inflation in municipalities with 2,500 to 5,000 residents (58.1%). However, the very smallest communities with less than 1,000 residents have also seen somewhat greater growth in debt than mid-sized communities.”
Offering suggestions to explain the trends, the report theorized that while most local governments saw spikes during the Great Recession, debt decreased in the following years. Debt has risen since 2014. The report cited low interest rates, rising needs and costs of infrastructure and other capital projects, and efforts to attract economic development, as causes for increasing debt.
The report further cited state-imposed limits on property tax levies as an impetus for borrowing.
The report stated: “State law limits the amount that local governments can raise property taxes annually for their operations to the rate of new construction in a community. The law, however, also provides an exception equal to the added amount needed to make (general obligation) debt payments, giving towns and other local governments an incentive to borrow for expenses they previously might have paid for in cash.”
In conclusion, the report finds that while debt is “ an essential tool for local governments … for several years, the Wisconsin Policy Forum has been warning that rising debt levels could start to crowd out other spending on key local services such as public safety.”
Further, the report concluded: “rising interest rates, slowing growth in property values and ongoing infrastructure and IT needs will add to the challenges moving forward.”
Included within the report is an interactive tool through which changes within each municipality and county’s debt level over the past 20 years can be viewed.
A link to the interactive tool is here: https://wispolicyforum.org/explore-local-government-debt-levels-in-wisconsin/.
The full report is here: https://wispolicyforum.org/wp-content/uploads/2022/11/Focus_22_21_LocalDebt.pdf.
About the Wisconsin Policy Forum
According to its website, the Wisconsin Policy Forum is a statewide nonpartisan, independent policy research organization with offices in Milwaukee and Madison. It provides informed analysis of critical policy issues affecting local governments, school districts, and the state of Wisconsin. Forum research and facilitation activities encourage elected officials and community leaders to find effective, data-driven solutions to pressing policy challenges, and promote productive discussion among the public and private sectors. To learn more about the forum, visit its website: https://wispolicyforum.org.
Following are depictions of changes in debt level over the last 20 years for several communities within the Fort Atkinson Online readership area.

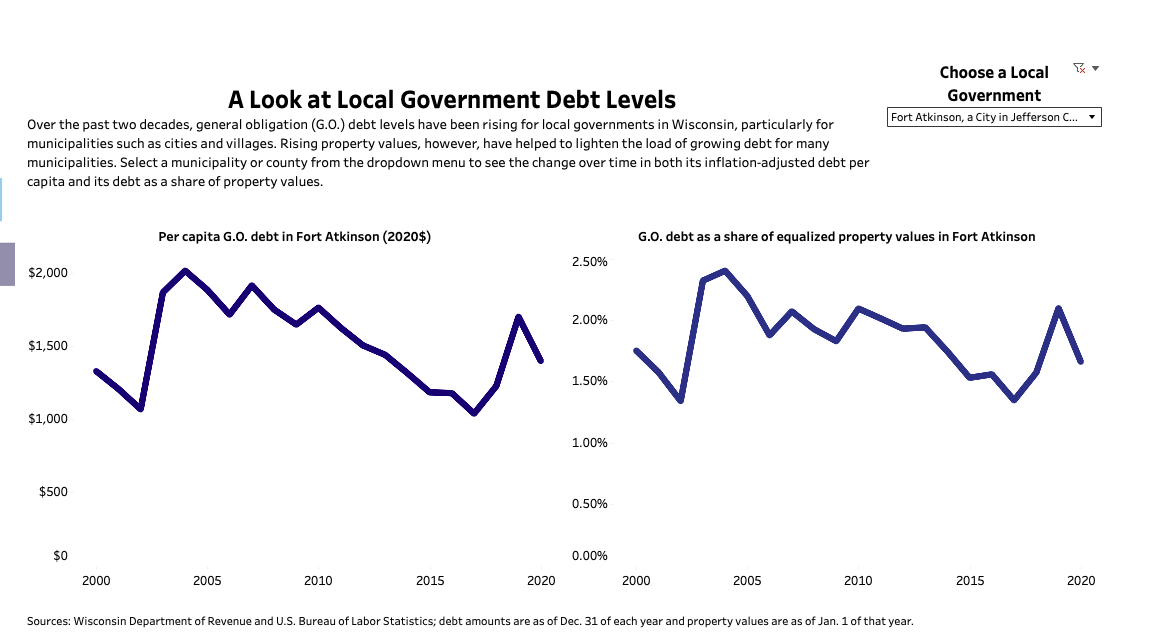
City of Fort Atkinson
A graph, as developed by the Wisconsin Policy Forum and shown above, depicts both a 20-year trend, between 2000 and 2020, in general obligation debt and general obligation debt as a share of equalized property values in the city of Fort Atkinson. A more detailed view is here: http://fortatkinsononline.com/wp-content/uploads/2022/11/city-of-fort-forum-debt-.pdf.
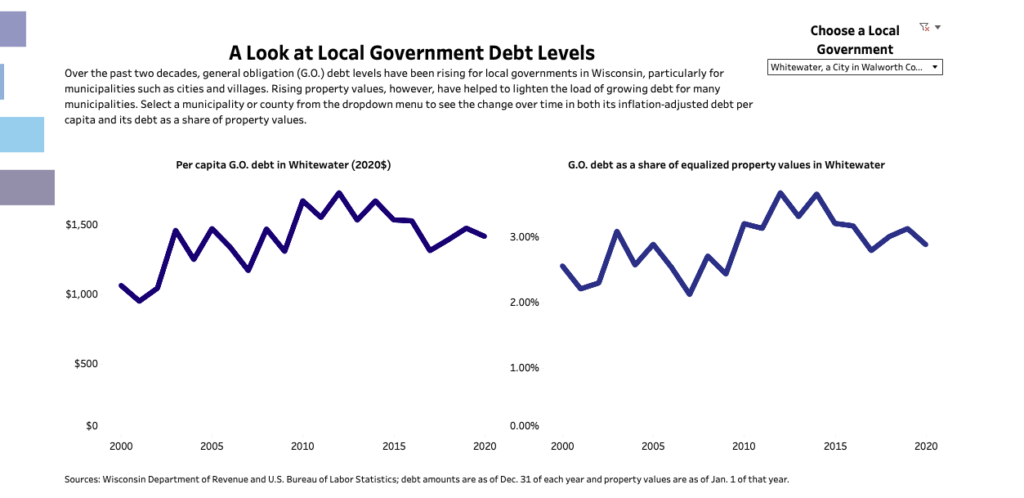
City of Whitewater
A graph, as developed by the Wisconsin Policy Forum and shown above, depicts both a 20-year trend, between 2000 and 2020, in general obligation debt and general obligation debt as a share of equalized property values in the city of Whitewater. A more detailed view is here: http://fortatkinsononline.com/wp-content/uploads/2022/11/city-of-whitewater-forum-debt-.pdf.
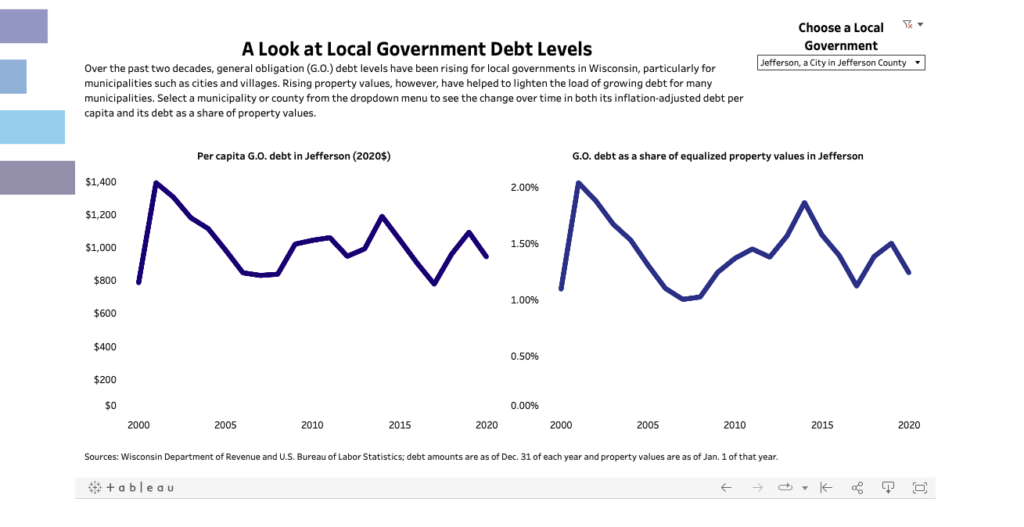
City of Jefferson
A graph, as developed by the Wisconsin Policy Forum and shown above, depicts both a 20-year trend, between 2000 and 2020, in general obligation debt and general obligation debt as a share of equalized property values in the city of jefferson. A more detailed view is here: http://fortatkinsononline.com/wp-content/uploads/2022/11/city-of-jefferson-forum-debt-.pdf.
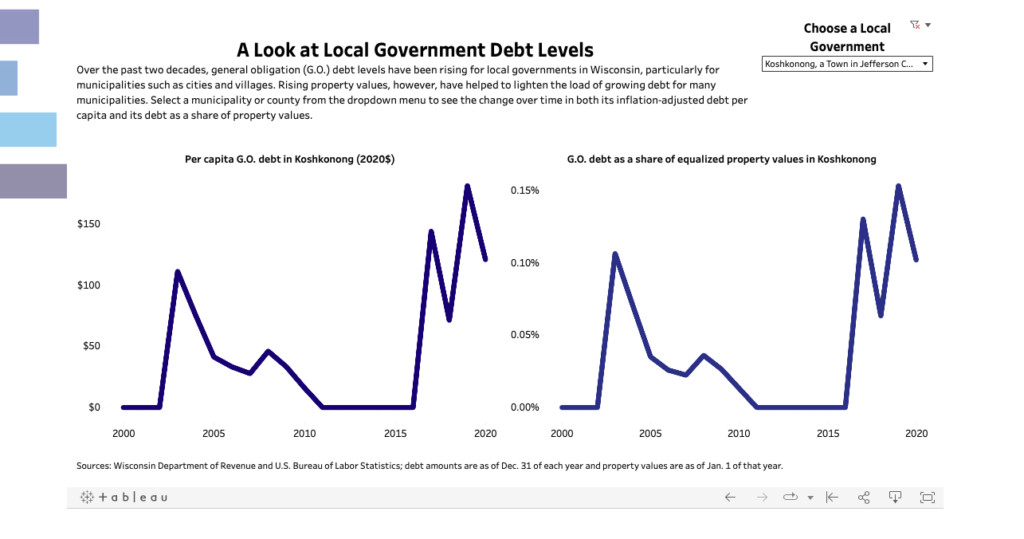
Town of Koshkonong
A graph, as developed by the Wisconsin Policy Forum and shown above, depicts both a 20-year trend, between 2000 and 2020, in general obligation debt and general obligation debt as a share of equalized property values in the town of Koshkonong. A more detailed view is here: http://fortatkinsononline.com/wp-content/uploads/2022/11/Koshkonong-policy-forum-debt-.pdf.
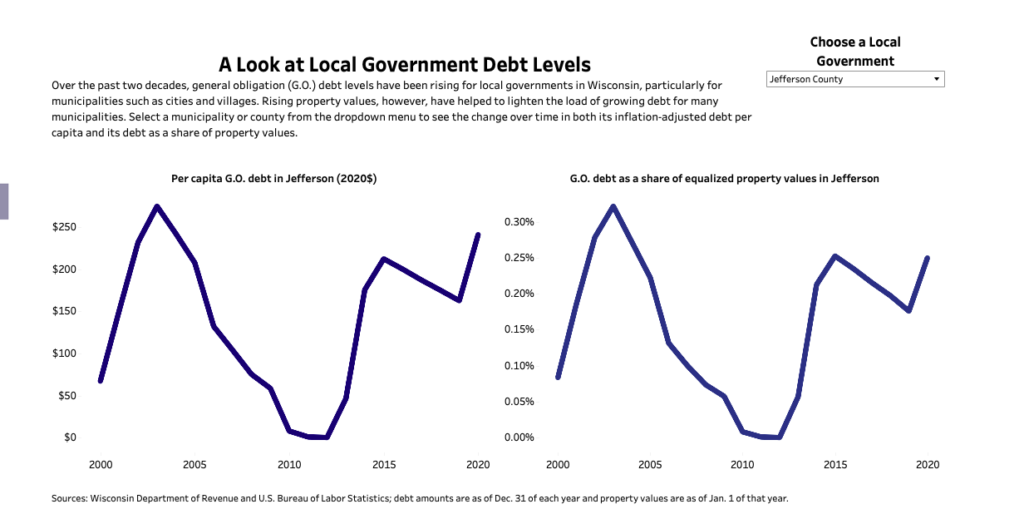
Jefferson County
A graph, as developed by the Wisconsin Policy Forum and shown above, depicts both a 20-year trend, between 2000 and 2020, in general obligation debt and general obligation debt as a share of equalized property values in Jefferson County. A more detailed view is here: http://fortatkinsononline.com/wp-content/uploads/2022/11/jefferson-county-forum-debt-.pdf.
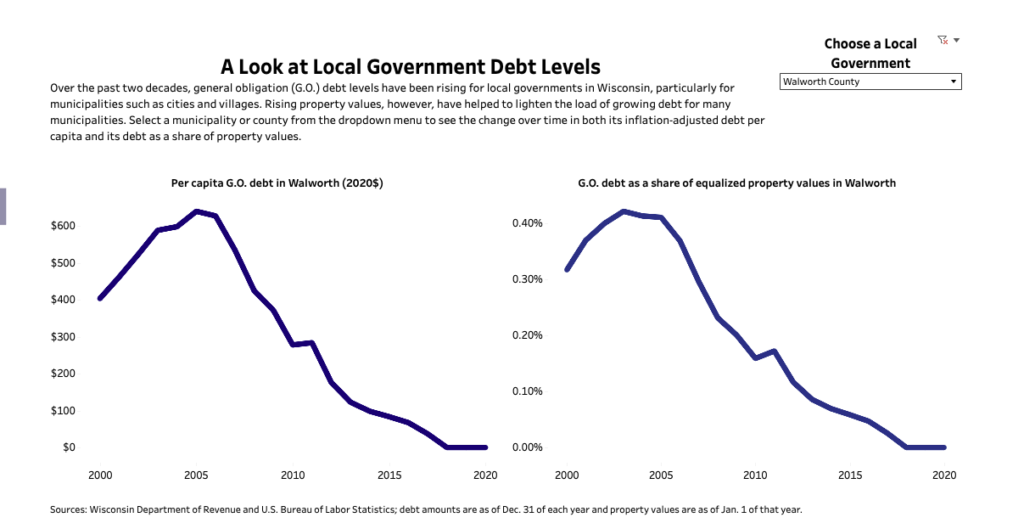
Walworth County
A graph, as developed by the Wisconsin Policy Forum and shown above, depicts both a 20-year trend, between 2000 and 2020, in general obligation debt and general obligation debt as a share of equalized property values in Walworth County. A more detailed view is here: http://fortatkinsononline.com/wp-content/uploads/2022/11/walworth-county-forum-debt-.pdf.
This post has already been read 603 times!