


By Kim McDarison
The School District of Fort Atkinson Board of Education was presented recently with data collected by Donovan Group, the organization hired by the district to create and facilitate a district needs community survey.
The survey was made available online in November.
Two representatives from Milwaukee-based Donovan Group, including its president and founder Joe Donovan and the organization’s Lead Survey Strategist Perry Hibner were in attendance during the board’s Dec. 13 meeting.
A presentation about the survey and its results was given by Donovan as an addendum to a presentation given by School District of Fort Atkinson Superintendent Rob Abbott, who spoke about achievements made by the district as it works towards goals set forth in the district’s strategic plan. Future plans to address the district’s identified facilities needs is a component of one of the strategic plan’s goals, Abbott said, which addresses the district’s desire to create “an inclusive culture of growth and being responsive to our learner and community needs.”
Abbott’s update, outlining strategic plan goals and achievements, is here: https://fortatkinsononline.com/school-district-strategic-plan-update-shared/.
Facilities needs as identified by the district include their accessibility, status and safety, Abbott said.
Data and analysis
During his presentation, Donovan noted that his company has worked with the School District of Fort Atkinson before, in 2019, at which time it helped facilitate a similar survey, designed to learn from stakeholders their thoughts about supporting an operational referendum. The more recent survey, he said, focused on two referendums, one operational and another for facilities improvements.
Donovan began his presentation by explaining some of the methodology used when analyzing the data.
“The following data points are not based on a scientific sample. Because we used a convenience sample, it would be methodologically inappropriate to conduct regression analysis or attempt to calculate error,” Donovan said, adding that a convenience sample is different from polling.
“We want everyone in the district community to participate in the survey. We don’t just do sampling … And as you’re going to see in a moment, … what we do is we disaggregate the data into different groups to ensure that we have enough people participating in the survey.
“We’re not going to calculate error. We haven’t run regression,” Donovan said.
He added: “How I like to look at this is if we sat down with coffee with a large number of your community members.”
Donovan said the survey presented in November was completed and returned by 998 respondents.
The survey opened on Nov. 1 and closed on Nov. 15.
“The purpose of the survey was to gather feedback from community members to evaluate solutions that meet the community’s needs, are financially responsible, and move the district and community forward. The district also aimed to gauge the community’s support for a potential operational referendum,” he said.
Number of respondents
Of the 998 respondent, 320, or about 32% of total respondents, were placed in a “comparison group,” Donovan said.
The number represents respondents to the survey who are not parents of preschool or school-aged children, district students or employees.
“Why do we do that?” Donovan asked. He answered: “What we’ve learned after doing this for a long time, is that when we provide school surveys to parents, and especially if we talk about things that involve a referendum, parents — and I’m a parent of two high school-aged students — I may be more likely to support a referendum as a result of the fact that I’m very close to my children’s school. Whereas my 86-year-old mother, who hasn’t had a child in school for a very long time, may be less connected.
“Now, what we often tend to find is that people like my mom tend to vote in higher numbers. In many communities, people who don’t have a connection to the school district, can be 70, 75, 80%. So we like to present these numbers so that we have a better case. We kind of have two ends of the spectrum. As we go through this, I’m going to talk about the ‘All Respondent’ group and I’m also going to talk about the ‘Comparison Group.’ Once we get to the point where we talk about some specifics, we tend to find that comparison groups tends to be less supportive of a referendum. So that’s just something that you should know.”
Additionally, Donovan said, his company has noticed that since the onset of the COVID-19 pandemic, participation in surveys is down. In some cases, he said, as much as 20%.
“Yours, on the other hand, is up significantly.” In 2019, he said, “when I stood before you, we had 554. He described the increase as “significantly more.”
Looking at the comparison group. In 2019, he said, there were 184 respondents as compared to November’s comparison group’s 320 respondents.
Summary of questions; key issues
Donovan noted that during his presentation he would focus on those questions which he described as related to main or key issues.
Following are questions and associated responses shared during the presentation:
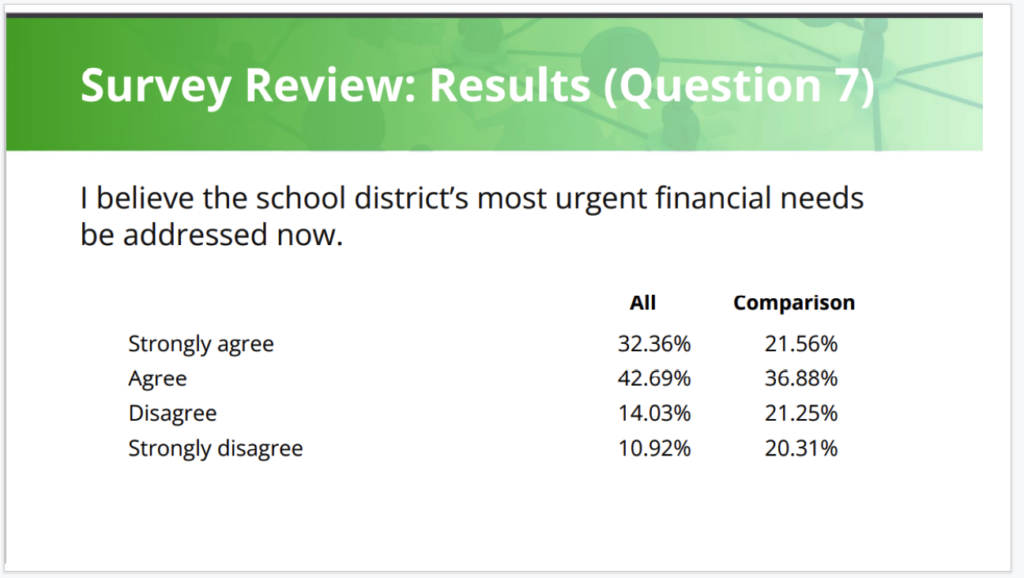
Question 7: I believe the school district’s most urgent financial needs be addressed now.
As part of his analysis of data presented in response to Question 7, shown above, Donovan said: “In years past, we only focused on the operational parts. With this survey, we did both the operational parts and the facilities.
“We will talk about operations first.”
Donovan said he would combine “strongly agree” and “agree,” responses as well as “disagree” and “strongly disagree.”
He said such pairing “tends to show an accurate picture of how referendum results break down.”
He identified Question 7 as one that focused on needs with regard to operations, noting that 75% of the “all respondents” group strongly agreed or agreed with the presented statement versus 58.4% of respondents in the “comparison” group.
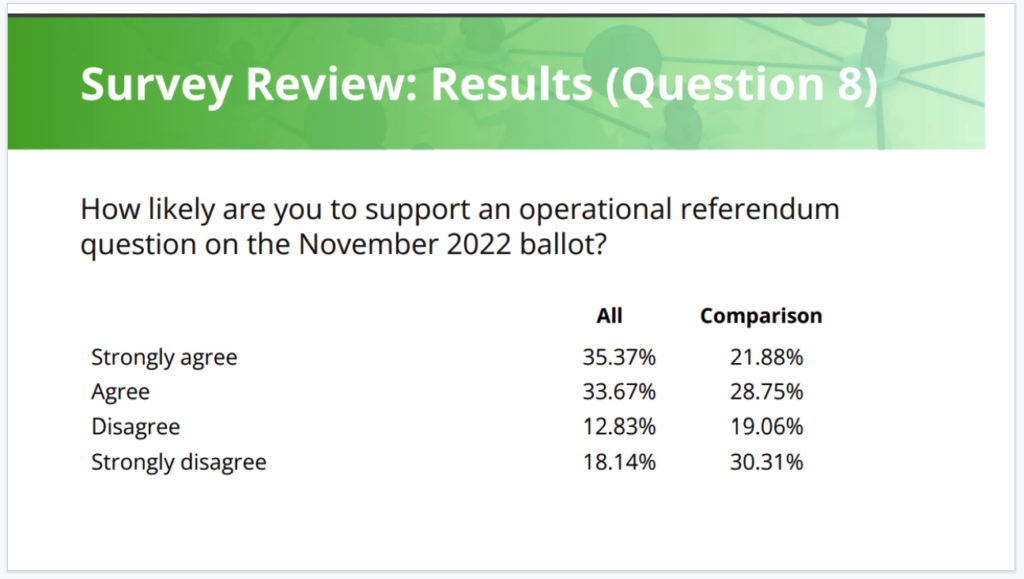
Question 8: How likely are you to support an operational referendum question on the November 2022 ballot?
Sharing statistics from Question 8, shown above, and combining responses within the categories of “strongly agree” and “agree,” Donovan said responses in the all respondents group showed 69% supported the operational referendum, while just over 50% showed similar responses in the comparison group.
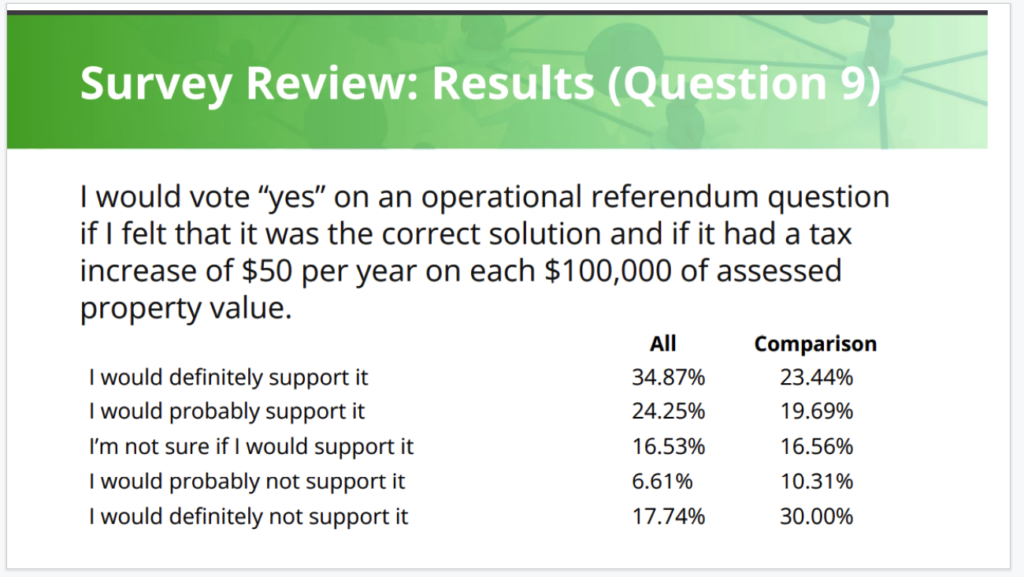
Question 9: I would vote “yes” on an operational referendum question if I felt that it was the correct solution and if it had a tax increase of $50 per year on each $100,000 of assessed property value.
Sharing statistics from Question 9, shown above, and combining responses within the categories of “definitely support” and “probably support,” Donovan said 59% of all respondents would be supportive, compared with 43.1% for the comparison group.
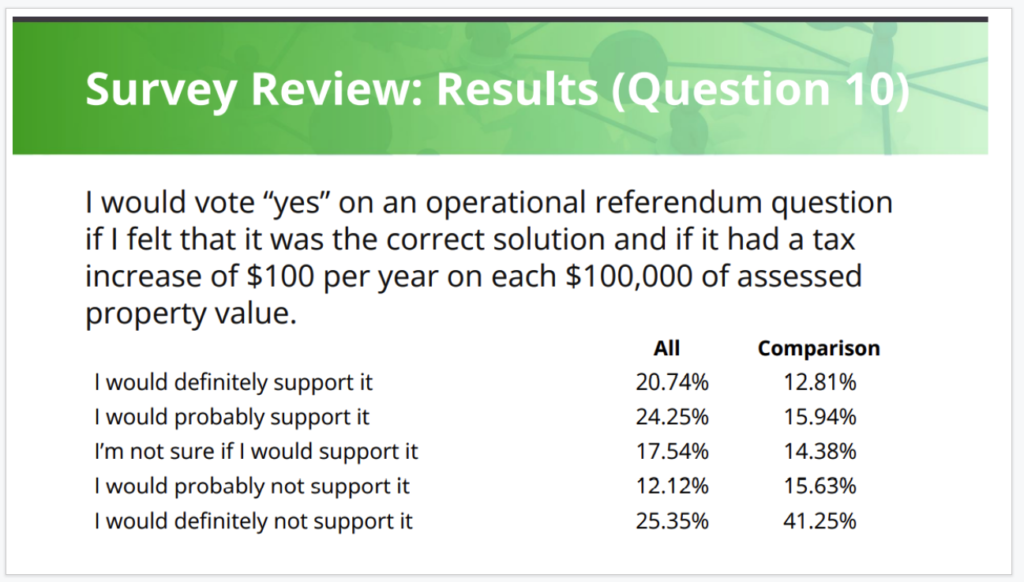
Question No 10: Same question as No. 9, but with the tax increase set at $100 per year on each $100,000 of assessed property value.
Sharing statistics from Question 10, shown above, and combining responses within the categories of “definitely support” and “probably support,” Donovan said 45% of all respondents would be supportive, compared with 28.8% for the comparison group.
“You’re going to see the numbers go down as the dollar amounts go up,” Donovan said.
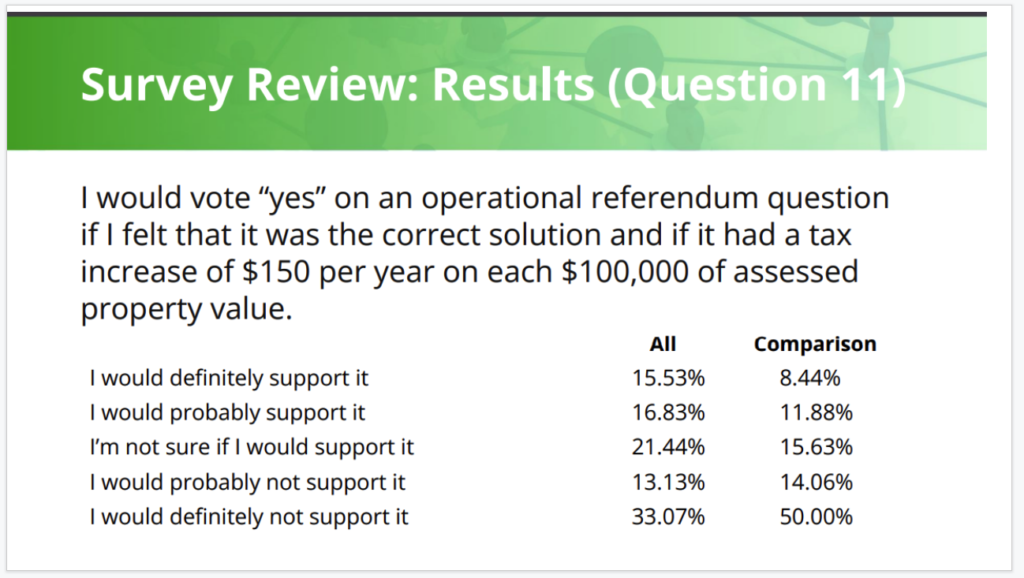
Question 11: Same as above two, but with $150 per year tax increase on $100,000 assessed value.
Sharing statistics from Question 11, shown above, and combining responses within the categories of “definitely support” and “probably support,” Donovan said 32.4% of all respondents would be supportive, noting a drop in support from the previous question of 13 points, compared with 20.3% for the comparison group.
“You’ll note here that not only are people not supporting it at higher numbers, but we’re seeing definitely not supporting it go up as well,” Donovan said.
The questions that follow are focused on facilities needs, Donovan noted.
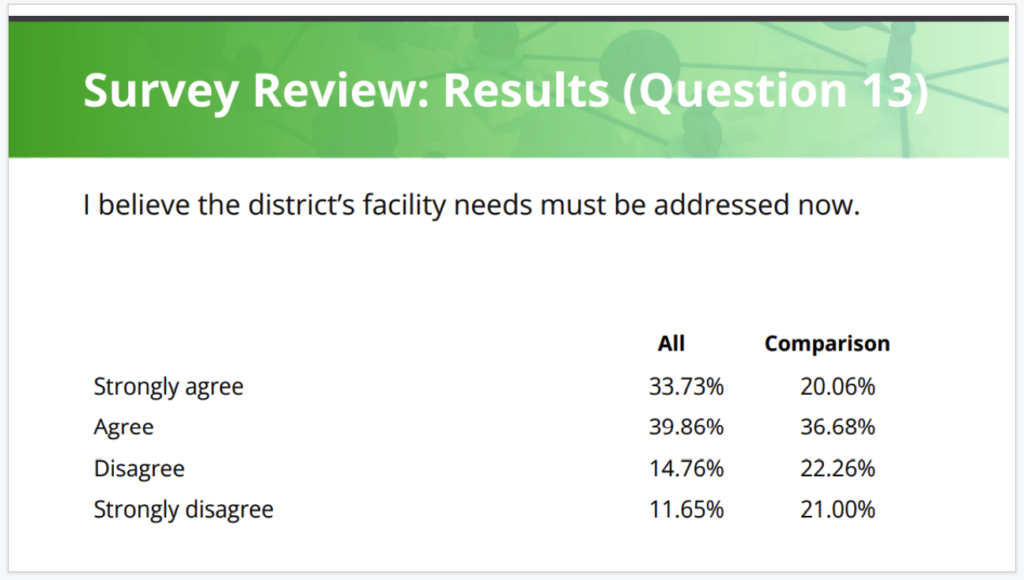
Question 13: I believe the district’s facility needs must be addressed now.
Sharing statistics from Question 13, shown above, and combining responses within the categories of “strongly agree” and “agree,” Donovan said responses in the all respondents group showed 73.6% would be supportive of the facilities referendum, while just over 56.7% showed similar responses in the comparison group.
Some background was provided with the survey, he said.
“We didn’t go into a tremendous amount of detail, for fear that we would lose people on the survey, … we just provided some background on the district’s facility needs and the question is one that we ask often for this type of survey.
“So the majority of your respondents are indicating that they … feel that the facility needs should be addressed now,” Donovan said.
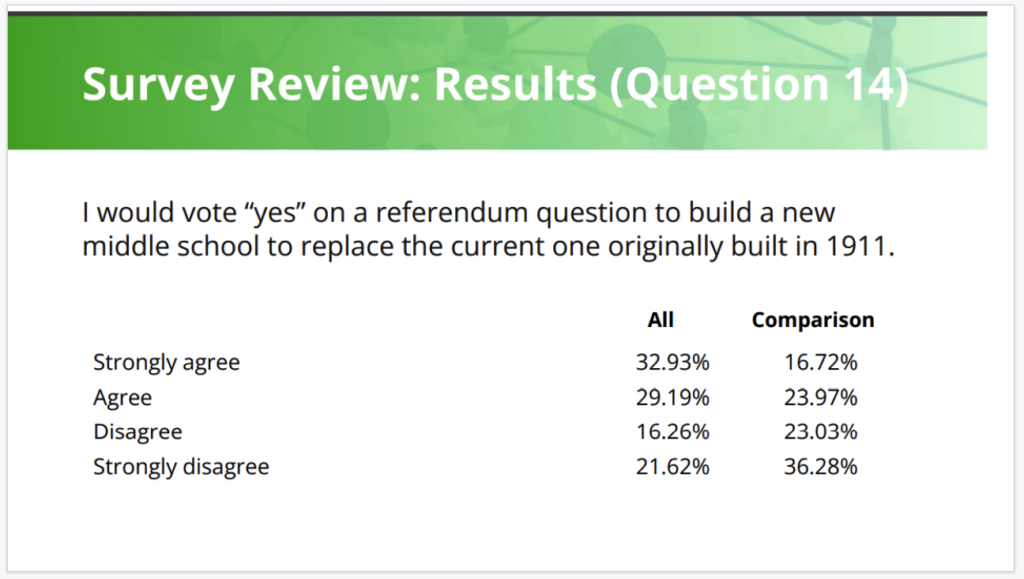
Question 14: I would vote “yes” on a referendum question to build a new middle school to replace the current one originally built in 1911.
Sharing statistics from Question 14, shown above, and combining responses within the categories of “strongly agree” and “agree,” Donovan said responses in the all respondents group showed 62.1% support for the facilities referendum, while 40.1% showed similar responses in the comparison group.
(Editor’s note: while the Fort Atkinson Middle School has had many updates and additions, according to district officials, “based on the 1982 plans set it appears that technically, a portion of the 1911 building remains.” The document notes, according to officials, that a wall, and some foundation and footing still remain.)
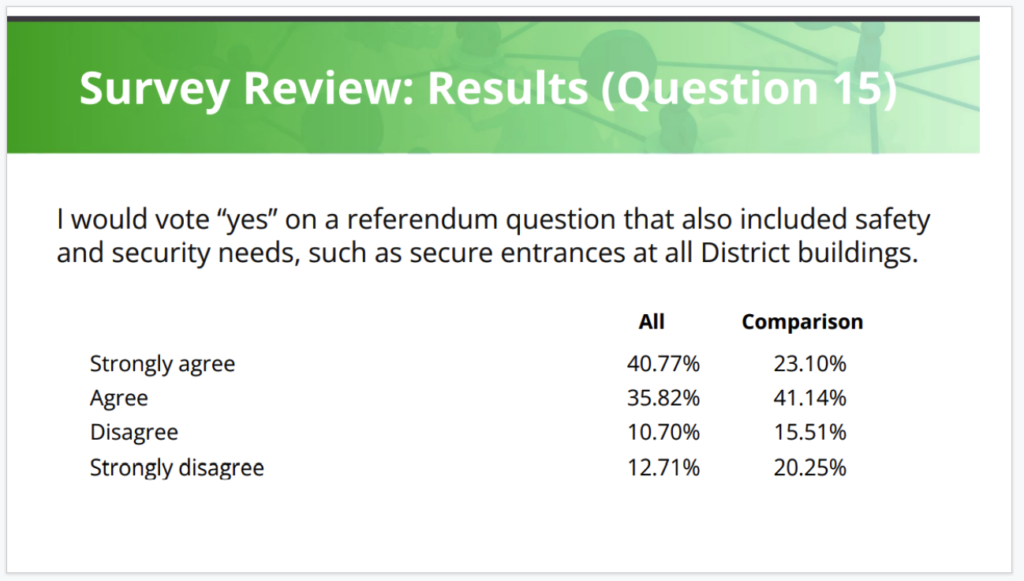
Question 15: I would vote “yes” on a referendum question that also included safety and security needs, such as secure entrances at all district buildings.
Sharing statistics from Question 15, shown above, and combining responses within the categories of “strongly agree” and “agree,” Donovan said responses in the all respondents group showed 76.6% support for the facilities referendum, while 64.2% showed similar responses in the comparison group.
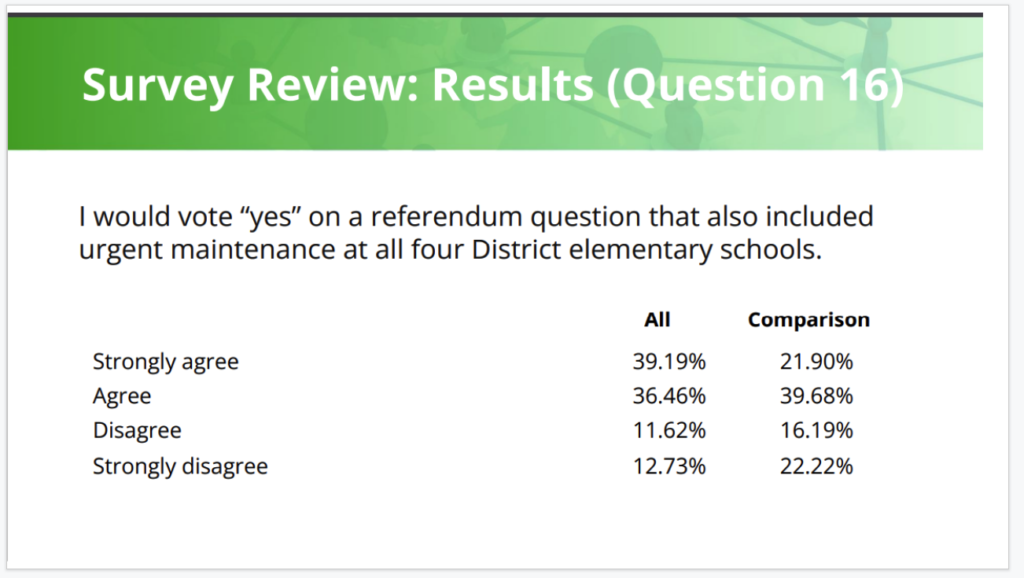
Question 16: I would vote “yes” on a referendum question that also included urgent maintenance at all four district elementary schools.
Sharing statistics from Question 16, shown above, and combining responses within the categories of “strongly agree” and “agree,” Donovan said responses in the all respondents group showed 75.7% support for the facilities referendum, while 61.6% showed similar responses in the comparison group.
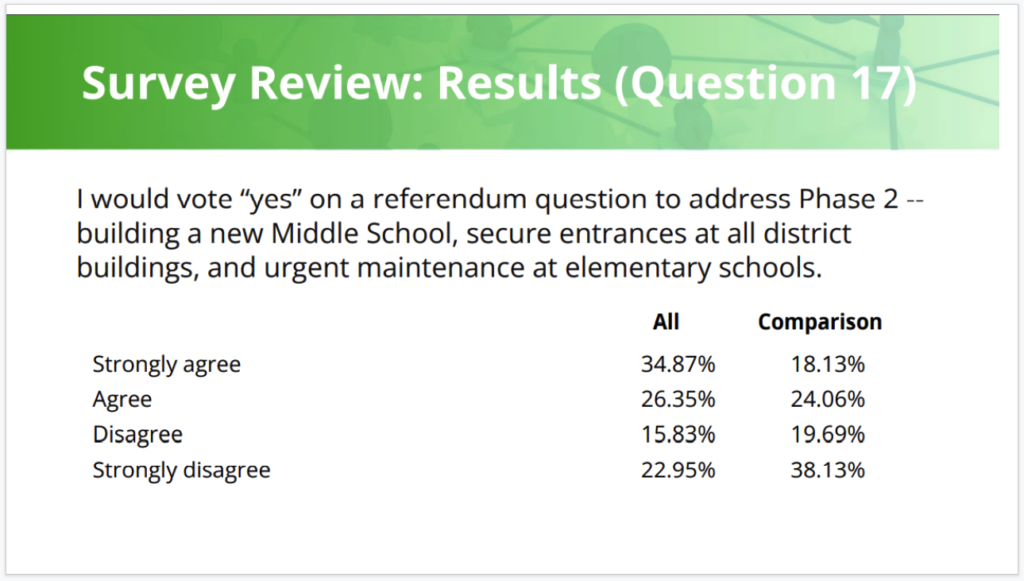
Question 17: I would vote “yes” on a referendum question to address Phase 2 — building a new middle school, secure entrances at all district buildings and urgent maintenance at elementary schools.
Sharing statistics from Question 17, shown above, and combining responses within the categories of “strongly agree” and “agree,” Donovan said responses in the all respondents group showed 62.2% support for the facilities referendum, while 42.2% showed similar responses in the comparison group.
“We are asking this question without indicating cost. You’re going to see that we include cost a little bit later,” Donovan said.
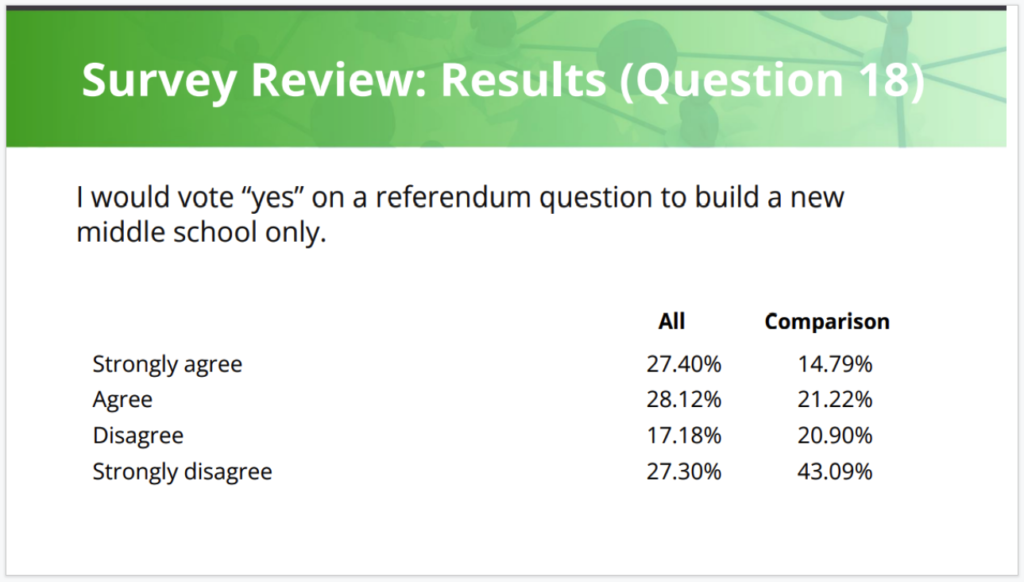
Question 18: I would vote “yes” on a referendum question to build a new middle school only.
Sharing statistics from Question 18, shown above, and combining responses within the categories of “strongly agree” and “agree,” Donovan said responses in the all respondents group showed 55.5% support for the facilities referendum, while 36% showed similar responses in the comparison group.
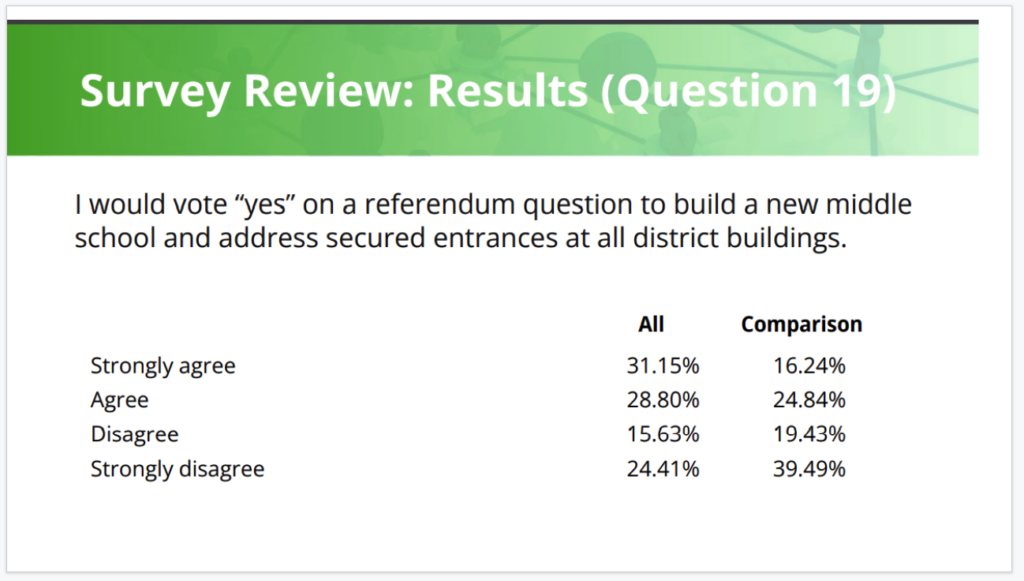
Question 19: I would vote “yes” on a referendum question to build a new middle school and address secured entrances at all district buildings.
Sharing statistics from Question 19, shown above, and combining responses within the categories of “strongly agree” and “agree,” Donovan said responses in the all respondents group showed 60% support for the facilities referendum, while 41% showed similar responses in the comparison group.
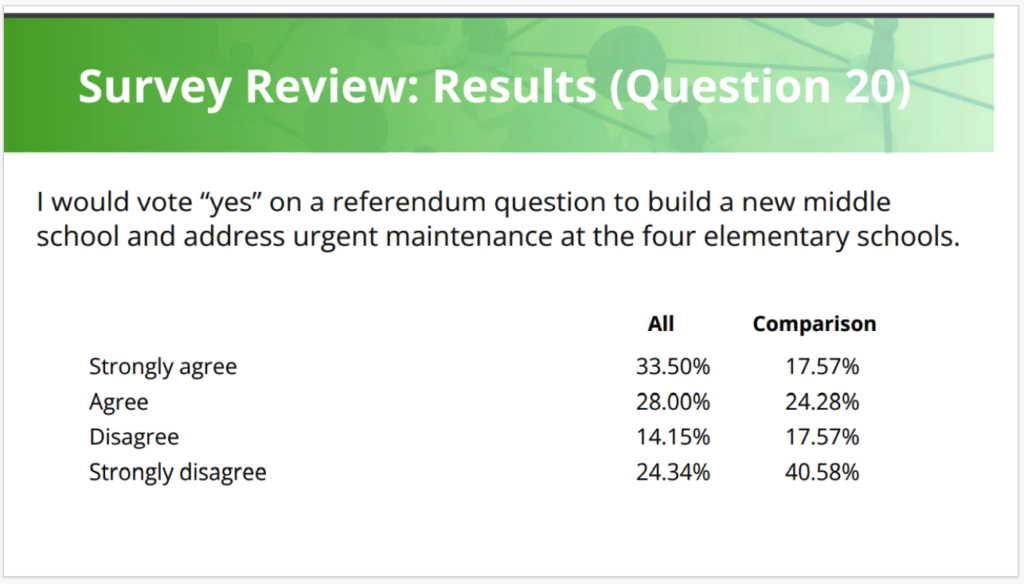
Question 20: I would vote “yes” on a referendum question to build a new middle school and address urgent maintenance at the four elementary schools.
Sharing statistics from Question 20, shown above, and combining responses within the categories of “strongly agree” and “agree,” Donovan said responses in the all respondents group showed 61.5% support for the facilities referendum, while 41.9% showed similar responses in the comparison group.
Said Donovan: “So at this point, board members, we provided some backgrounds on the needs; we outlined at a high level some different solutions. Now we get into some specific questions.”
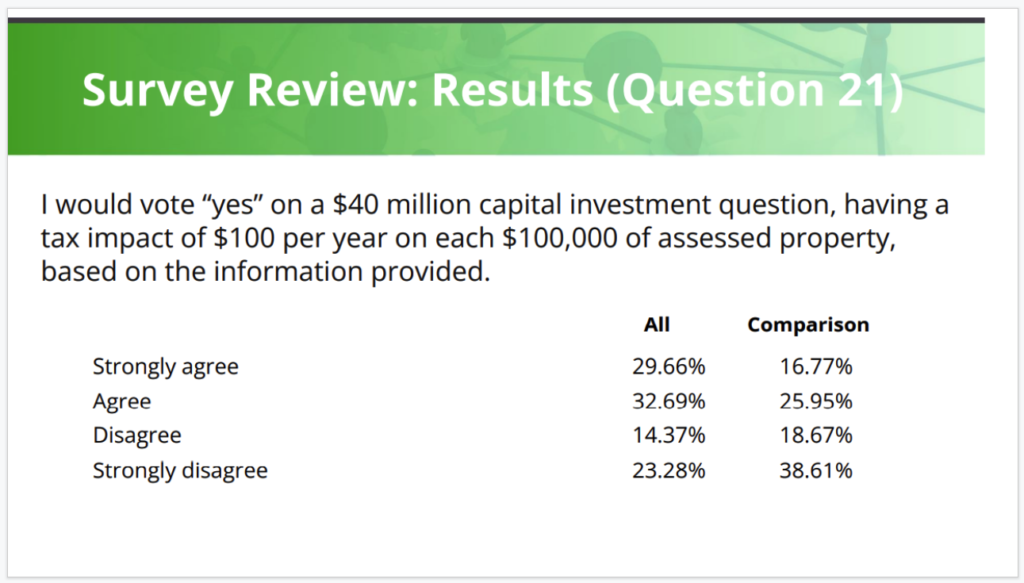
Question 21: I would vote “yes” on a $40 million capital investment question, having a tax impact of $100 per year on each $100,000 of assessed property, based on the information provided.
Sharing statistics from Question 21, shown above, and combining responses within the categories of “strongly agree” and “agree,” Donovan said responses in the all respondents group showed 62.4% support for the facilities referendum, while 42.7% showed similar responses in the comparison group.
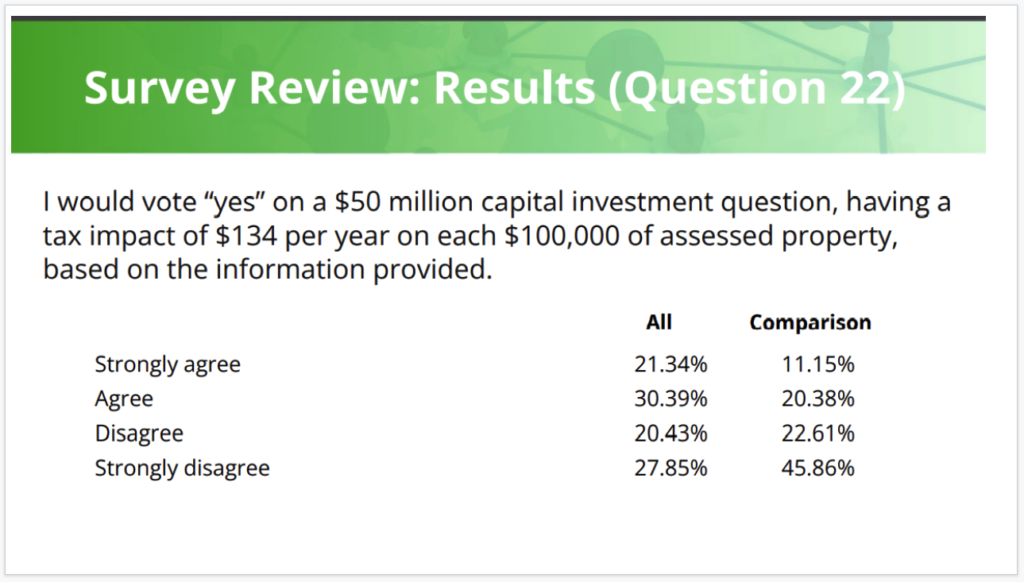
Question 22: I would vote “yes” on a $50 million capital investment question, having a tax impact of $134 per year on each $100,000 of assessed property, based on the information provided.
Sharing statistics from Question 22, shown above, and combining responses within the categories of “strongly agree” and “agree,” Donovan said responses in the all respondents group showed 51.7% support for the facilities referendum, while 31.5% showed similar responses in the comparison group.
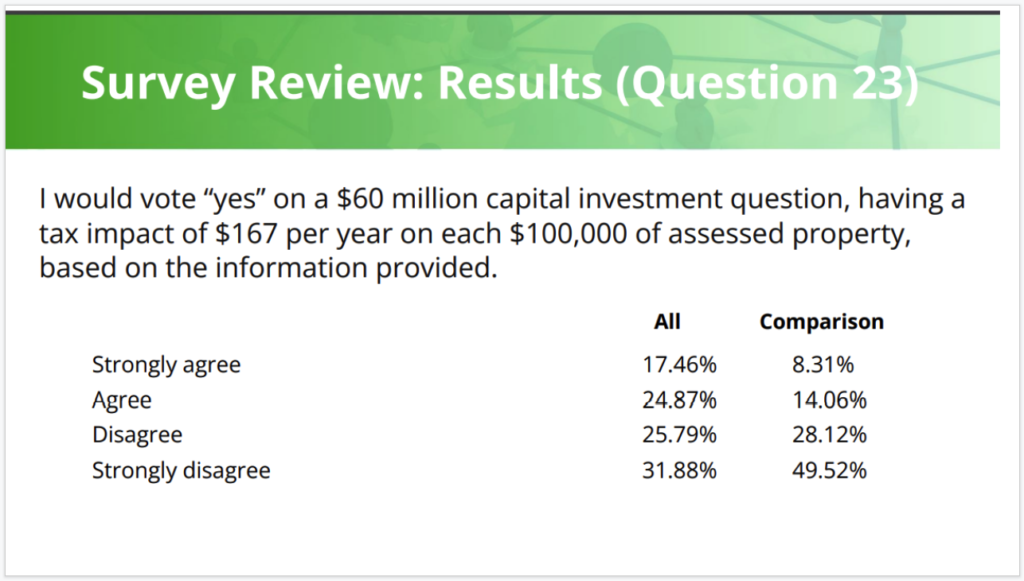
Question 23: I would vote “yes” on a $60 million capital investment question having a tax impact of $167 per year on each $100,000 of assessed property, based on the information provided.
Sharing statistics from Question 23, shown above, and combining responses within the categories of “strongly agree” and “agree,” Donovan said responses in the all respondents group showed 42.3% support for the facilities referendum, while 22.4% showed similar responses in the comparison group.
“We continue (as numbers go up) to see support decline. So, again, a couple of takeaways: Again, very high participation rate. And high participation rate, even if it was a situation where we would see high participation rate, which, as I mentioned, we’re not. We are seeing things trend down. That indicates a willingness for people to engage with you at a very high level including, I will mention, a relatively large number of people, again, who don’t have children currently in the school district. That suggests, again, a high level of engagement,” Donovan said.
Next steps
School District of Fort Atkinson Communications and Community Engagement Specialist Marissa Weidenfeller, addressing the board to outline next steps, said: “Please don’t get discouraged, I see this as a great opportunity for us; our community is willing to engage with us and give us some information. And so I think we have a lot of opportunity. We are about a year out, so people are willing to talk. So in addition, you will be getting some more financial information and as tax bills are coming up and we are figuring out our budget cycle, I’m working on an extensive communication plan with our team as far as additional community engagement opportunities throughout January, February, March and April. Also, focus groups to community conversation, PTO meetings, conferences, so we’ll be a little bit of everywhere.”
Questions from board members
School District of Fort Atkinson Board of Education President Mark Chaney said he was confident in the district’s ability to communicate the district’s plan.
“I think given where we are at and the climate we are in, that those numbers are not as icky as they might look at first glance,” he said.
“We are seeing — we call it turbulence — we’re seeing a lot of turbulence in the world; that’s an understatement. And where we have done work with districts — and in a lot of cases we are very fortunate to work with districts over many years — and I can’t tell you that I’ve seen numbers up significantly from district to district,” Donovan said.
He added: “Not only are you early in the process, but a tremendous amount of great work has been done to date.”
Further, he said: “I often think that community conversation around both an operational and a facilities piece are related to needs, process and solution. Board members, you didn’t wake up this morning and say: ‘I can’t wait to go to referendum.’ You go to referendum because you need to. And you’ve defined the needs and you’ve gone to your community. You’ve been able to have essentially a thousand conversations with community members and they’ve told you, at least 75% of those people, have said that they strongly agreed or agreed with the question: Our most urgent financial needs must be addressed now, and our facility needs must be addressed now.
“You have plenty of time to figure that out and move forward, and you have a great start already.”
“I know people want you to say this is going to be like this, and you can’t do that; there’s a lot of uncertainty about what you do, but I would assume that if you have a number approaching 50% in the comparison group, that’s probably good. Is there — I’m sure you have to look at the percentages — but is 50% the confidence number, or is it somewhere in the 40s? When you’re trying to figure out what level to go after, what’s your biggest indicator of those two groups, of when you can start being more confident in what you want to ask?” School board member Adam Paul asked.
Donovan responded, saying: “That’s a great question and I’m not going to answer it; I’m not going to give you a lot of satisfaction, I don’t think, with the answers, because there are so many variables. If this was a situation where the district was voting soon to put a question on the ballot, we would look at a comparison group number in particular, and if we saw a very, very low number, we saw 15% support, that would be bad news. Fifty percent, 55%, I think are very solid numbers, but I can tell you that the other piece of this is that I think that numbers change relatively quickly. None of us can forecast the future. But, again, I think that the high numbers related to your community telling you address these needs now, outlines the work ahead.”
Donovan said he was not “terribly surprised” by the community’s responses. He was happily surprised, he said, by the survey’s high participation rate.
Paul said he thought the numbers seemed to suggest that the public was more interested in security and maintenance issues than it was in the middle school.
“Generally speaking, we are seeing now a good amount — there’s always a good amount of sensitivity — about cost,” Donovan said.
He described 2008, during the recession, as another time when turbulence was high.
Said Abbott: “This survey was one piece of information gathering; it was not intended to be a decision-making tool, and it’s also why we placed it as really in a very lengthy and robust information gathering process.
“I don’t think it’s about having numbers that we necessarily like or dislike.”
He said the information provided by the survey was “authentic and is real information coming from real people who will be working with us over the course of the next several months to help us figure out what it is we want to do moving forward.”
He cited the survey as a tool that would better inform the board and the district when approaching the community with options, that, he said, “they don’t just view as palatable, but meaningful in addressing our needs. And that’s really what this process is set out to do.”
After the holidays, Abbott said, the district will be moving forward with “a very aggressive communications plan, not from a position of convincing, but from a position of moving to gather information. To hear from people, interact with people, and talk a little bit more fully about what the district’s needs are from a fiscal point of view as well as from a building point of view.”
The full survey report can be found on the district’s website, Abbott said.
This post has already been read 3011 times!